

Public health is complex and nuanced; identifying causes and effects of diseases and health factors of communities in a real-world context requires systemic, analytical approaches. Ranging from the prevention of the spread of infectious diseases to tackling environmental hazard issues, understanding the root causes of public health concerns and efficiently responding to health crises are integral purposes of public health. Within the interconnections of social, economic, environmental, geographical factors, how should we prioritize the equitable allocation of public health resources?
Serving to improve the overall health conditions of populations, data-driven insights help inform policymaking and interventions. Social Determinants of Health (SDOH) are non-medical conditions that affect people’s health, such as socioeconomic status, access to resources, geographic locations of where people are born, live, and work (World, 2025). Based on the frameworks of SDOH, researchers have developed quantitative indices to quantitatively and methodically identify and aid communities that need special interventions, policies, or response actions to health crises.
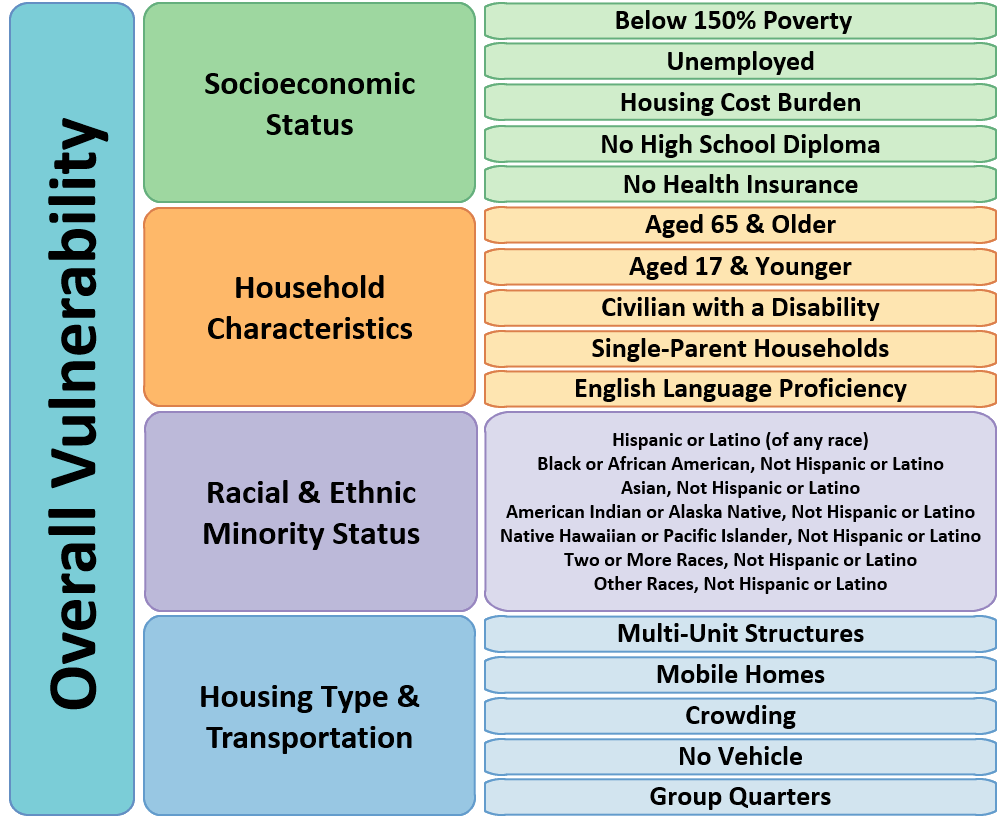
The Social Vulnerability Index (SVI) is an example of a SDOH index developed by Centers of Disease Control and Prevention (CDC) and the Agency for Toxic Substances and Disease Registry (Centers, 2024). SVI is a “place-based index, database, and mapping application designed to identify and quantify communities experiencing social vulnerability” (Centers, 2024). Its purpose lies in informing public health organizations and community leaders about communities’ vulnerability factors for emergency management, such as in preparedness or response to critical crises. SVI calculations are based on 16 census variables, which are categorized to the four themes of socioeconomic status, household characteristics, racial and ethnic minority status, and housing type and transportation. Using the 16 SVI variables from the 5-year American Community Survey (ACS), each census tract, block group, and ZIP Code Tabulation Area (ZCTA) is assigned a percentile rank from 0 to 1 relative to all other areas in a broader geography, such as the state or nation. The overall rank is the percentile rank of the sum of the four theme-level sums. Thus, a higher SVI value within the same geographical comparison level indicates a more vulnerable population community.

Notable applications of SVI in real-world disasters include the case study of the impact of Hurricane Katrina on New Orleans by Flanagan, et al. Hurricane Katrina occurred in and nearby the city of New Orleans, Louisiana, on August 29, 2005, causing an immense number of casualties and infrastructure damage. Katrina caused a total of 1,464 fatalities in the state of Louisiana. The study analyzes the relationship between the number of drowning deaths, which was identified to have been the number one cause of deaths among the exposed population of Katrina. Age-specific mortality rate shows that the majority of Katrina fatalities were suffered by the elderly, half of whom were older than 75 years of age, making them especially socially vulnerable. Out of the 15 tracts with a greater number of deaths than expected, 8 of them were located in areas where the elderly SVI value is within the highest third of the map. All other tracts, except one, were associated with the middle-level category.
For the analysis of the relationship between the population displacement and the indication of disaster recovery, SVI demonstrated potential as an effective tool for disaster response and recovery. Considering that over half of the displaced population of Katrina lived in New Orleans, change in mail delivery service usage was tracked as an indication of disaster recovery in the New Orleans area. Areas such as the New Orleans business district or the tourist center of French Quarter, are recording approximately or greater than 100% increase in mail delivery. They have experienced less damage, and were supported by the local agencies for rapid recovery. Areas that experienced greater damage (e.g., Lower Ninth Ward) and are associated with the highest third percentile group in the socioeconomic SVI category, have delivery rate less than 25% of pre-Katrina, indicating insubstantial recovery. Areas that have experienced heavy physical damage show significant decrease in mail delivery rate, and thus, slower signs of disaster recovery, regardless of the socioeconomic circumstances of the community. Socially vulnerable areas show slower signs of disaster recovery, regardless of physical damage done by Katrina. Areas that are both socially vulnerable and have suffered from immense physical loss by Katrina show slowest signs of recovery. In addition, There has been a 47% increase in general mortality rate post-Katrina (June 2006) than that of pre-Katrina (January 2006) in greater New Orleans area during disaster recovery phase, with the socially vulnerable people including women, children, elderly, and people with disabilities, disproportionately affected (Flanagan, 2011).

The potential implications of SVI can be applied beyond disaster management to public health issues and more. Flanagan mentions state, local, tribal agencies can utilize SVI to appropriately aid people based on unique characteristics of each community to prepare and distribute appropriate healthcare resources. Furthermore, Flanagan points out that SVI variables and calculation methods are continuously and flexibly updated biannually, in response to factors such as the rapid change of population in certain areas in recent years, promising up-to-date insights to community health.
In the face of public health crises, the usage of SVI can streamline the equitable resource allocation to socially vulnerable populations and communities. SVI concretizes the idea of social vulnerability, a concept that no longer has to be assessed solely qualitatively or illustratively. A system of data-driven insights into the levels of social determinants of health of each granular levels of community can improve communal approaches to all stages of disaster prevention, innovating and transforming public health assessments.
References
Centers for Disease Control and Prevention and Agency for Toxic Substances and Disease Registry. (n.d.). Social Vulnerability Index. https://www.atsdr.cdc.gov/place-health/php/svi/index.html
Flanagan, Barry E.; Gregory, Edward W.; Hallisey, Elaine J.; Heitgerd, Janet L.; and Lewis, Brian (2011) “A Social Vulnerability Index for Disaster Management,” Journal of Homeland Security and Emergency Management: Vol. 8: Iss. 1, Article 3. DOI: 10.2202/1547-7355.1792
World Health Organization. (n.d.). Social determinants of health. Retrieved October 5, 2025, from https://www.who.int/health-topics/social-determinants-of-health#tab=tab_1

Leave a comment